Programming Languages and Database
- Python for Data Science.
- Web Scraping with Python.
- SQL for data transformation.
- DBT.
Responsible for implementing the data stack and developing data analysis focused on Product at LeadSimple, a leading B2B SaaS company in the US for property management operations software.
Dadosfera is a cutting-edge startup focused on providing Data Platform services. We deliver consultancy in data science, data analysis, and data engineering, enabling our clients to achieve sustainable results through informed, data-driven decisions.
As a Data Consultant at Dadosfera, I am responsible for developing data-driven solutions for a diverse set of clients, my responsibilities span from conducting the initial ETL processes to implementing machine learning models and creating compelling data visualizations.
At Metapro, I was involved in developing commercial solutions that integrate sales strategies with data analysis. My role encompasses a range of activities, including market mapping, data extraction and analysis, defining actionable strategies, conducting negotiations and alignments with stakeholders, as well as managing outcomes through key performance indicators.
One of the main results was the commercial representation of the Mexichem industry (largest producer of tubes and connections in the world) in the region of Brasília and around Goiás, where I achieved a 262% increase in sales in 2020 vs. 2019, keeping the result in 2021.
Cement Ciplan is one of the largest cement companies in the central west region of Brazil. In this company, I led sales teams, monitoring and supporting the team based on data analysis, market context and company KPIs. I also fulfilled the demands of different stakeholders, such as: customers, sales team, internal commercial, financial, and production team.
Among the results in this period, I highlight the restructuring of 3 sales regions in less than 4 years, developing people, implementing processes, and building results through creative solutions, such as developing a new product in the market, which increased revenue. and improvement in the company's profitability in 2017 and 2018.
At Votorantim Cimentos, the largest cement industry in Brazil, I worked from 2010 to 2014. I started as a Business Analyst in the Logistics area, focusing on the preparation and maintenance of management reports and support for field teams based on data analysis and results. About 2 years later, I went to the commercial area as a Consultant, where I developed solutions for retailers, industries and construction companies in 3 Brazilian states: DF, GO and TO.
I stayed at Ambev from 2008 to 2009. I worked as an Industrial Quality Supervisor and was responsible for Quality Control at the Brasília plant, with a strong statistical base and a structure composed of 4 chemical laboratories and a team of around 20 employees.

To deploy a new loyalty program called Insiders, an unsupervised machine-learning
model of Clustering was developed, grouping the customer base according to their
similarities.
The group of special customers was formed by 3.7% of the customer base and
represents 37% of the company's revenue

To increase the sales team's performance during a Cross Sell campaign, a Classification Machine-Learning model was developed to generate a purchase propensity score and classify a base of 127 thousand customers. The trained model generated an extra revenue of $25,000,000.00.

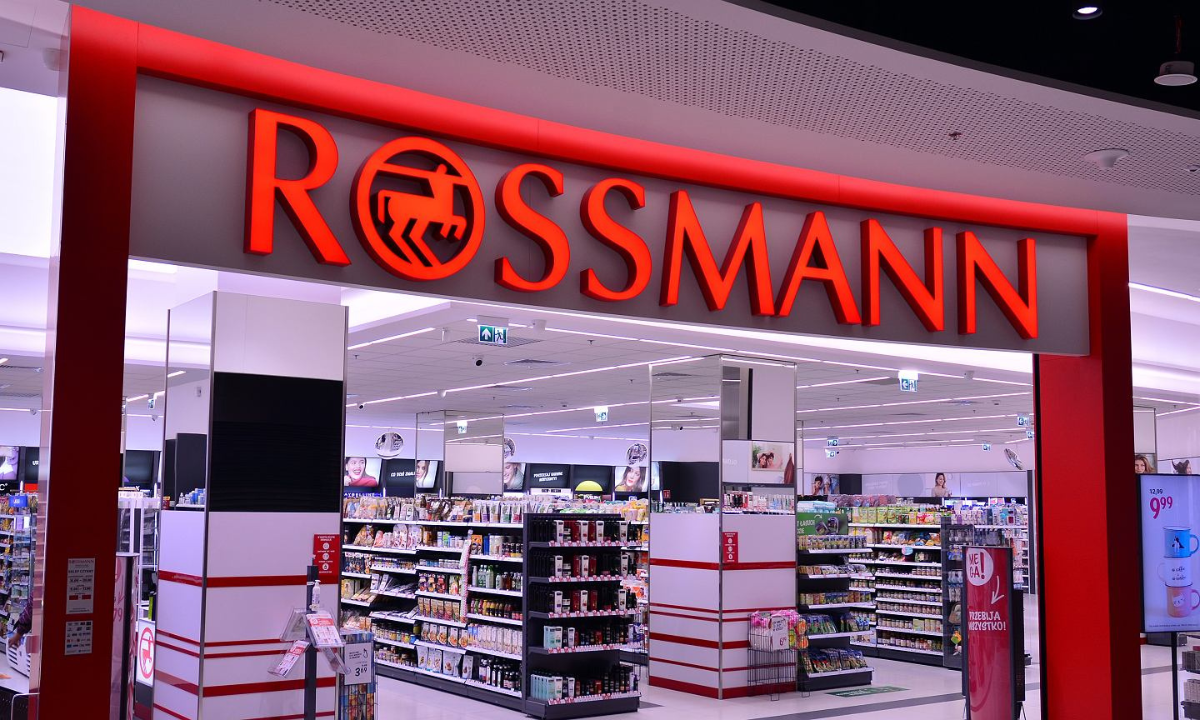
Development of a Machine Learning algorithm to predict sales 6 weeks in advance in a pharmacy chain in Europe. The trained Regression algorithm has 88% MAPE and was made available for queries through a Telegram bot.

A comprehensive analysis comparing data professionals in Brazil and the USA. Through this analysis, I dive deep into various roles, experience levels, and salary ranges, offering insights into the landscape of data professionals in these two countries.

In this final project of the certification in Data Analytics from Google, the analysis of data from the Cyclistic company was carried out to generate insights to increase the conversion rate from casual customers to annual subscribers

To maximize the company's return on investment, this Data Analysis project was developed using Python to identify opportunities for homes below the average market price and define when and at what price to resell these properties.

Development of a Dashboard in Power BI to visualize the evolution of 4 KPI's: Revenue, Sales Quantity, Average Ticket and Positivation. The results are detailed in the project by time period, by product and by collaborator.
Thanks for reading and feel free to get in touch.